Projects
COVID-19 data visualisation - R Shiny
This data visualization project was developed using Shiny. The home screen is divided into two parts. On the left side are the graphical controls with radio button and time slide. The graphics are displayed on the right side. This side has a tab for each dataset analysed.
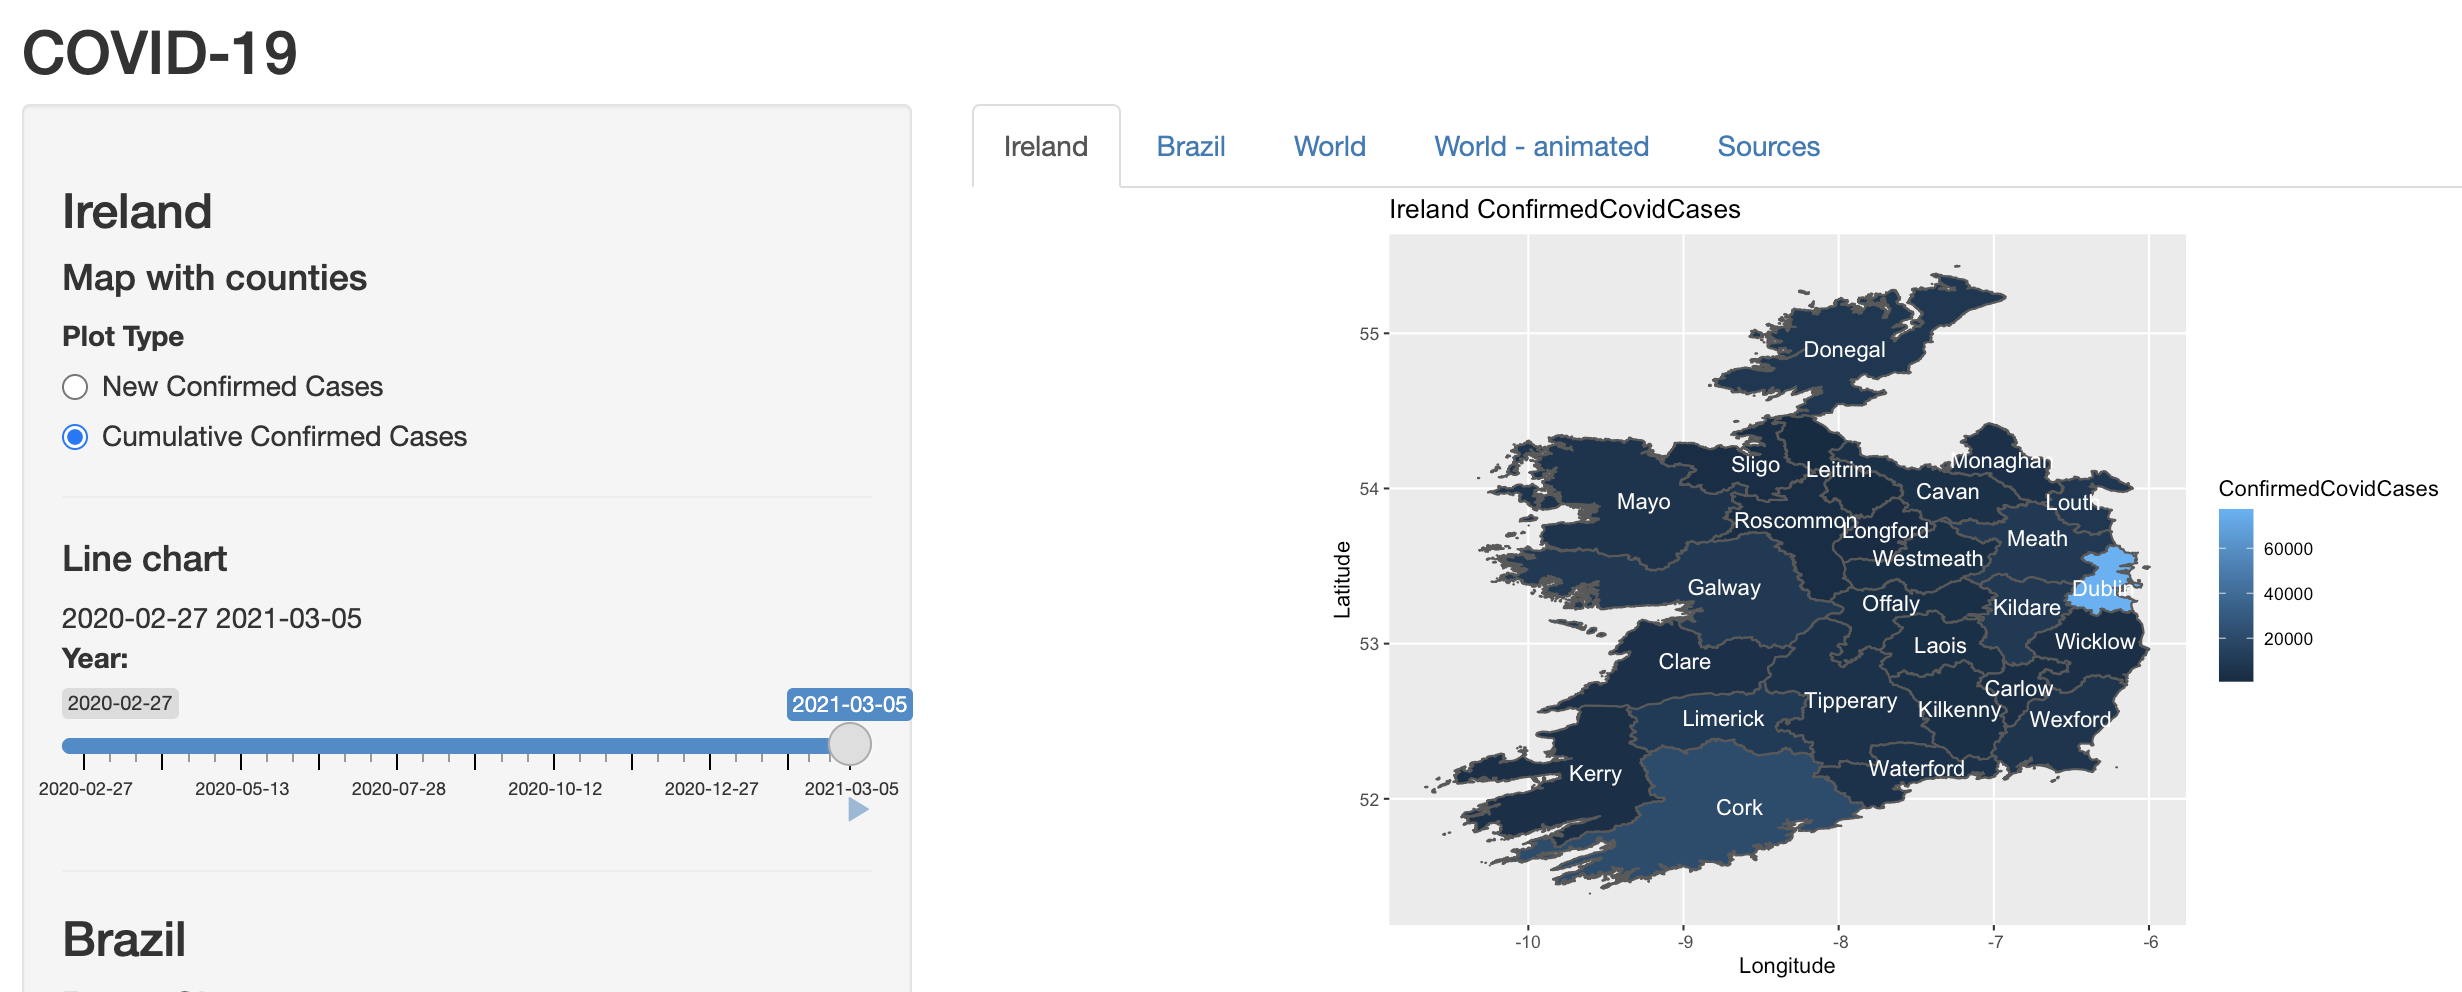 Ireland map
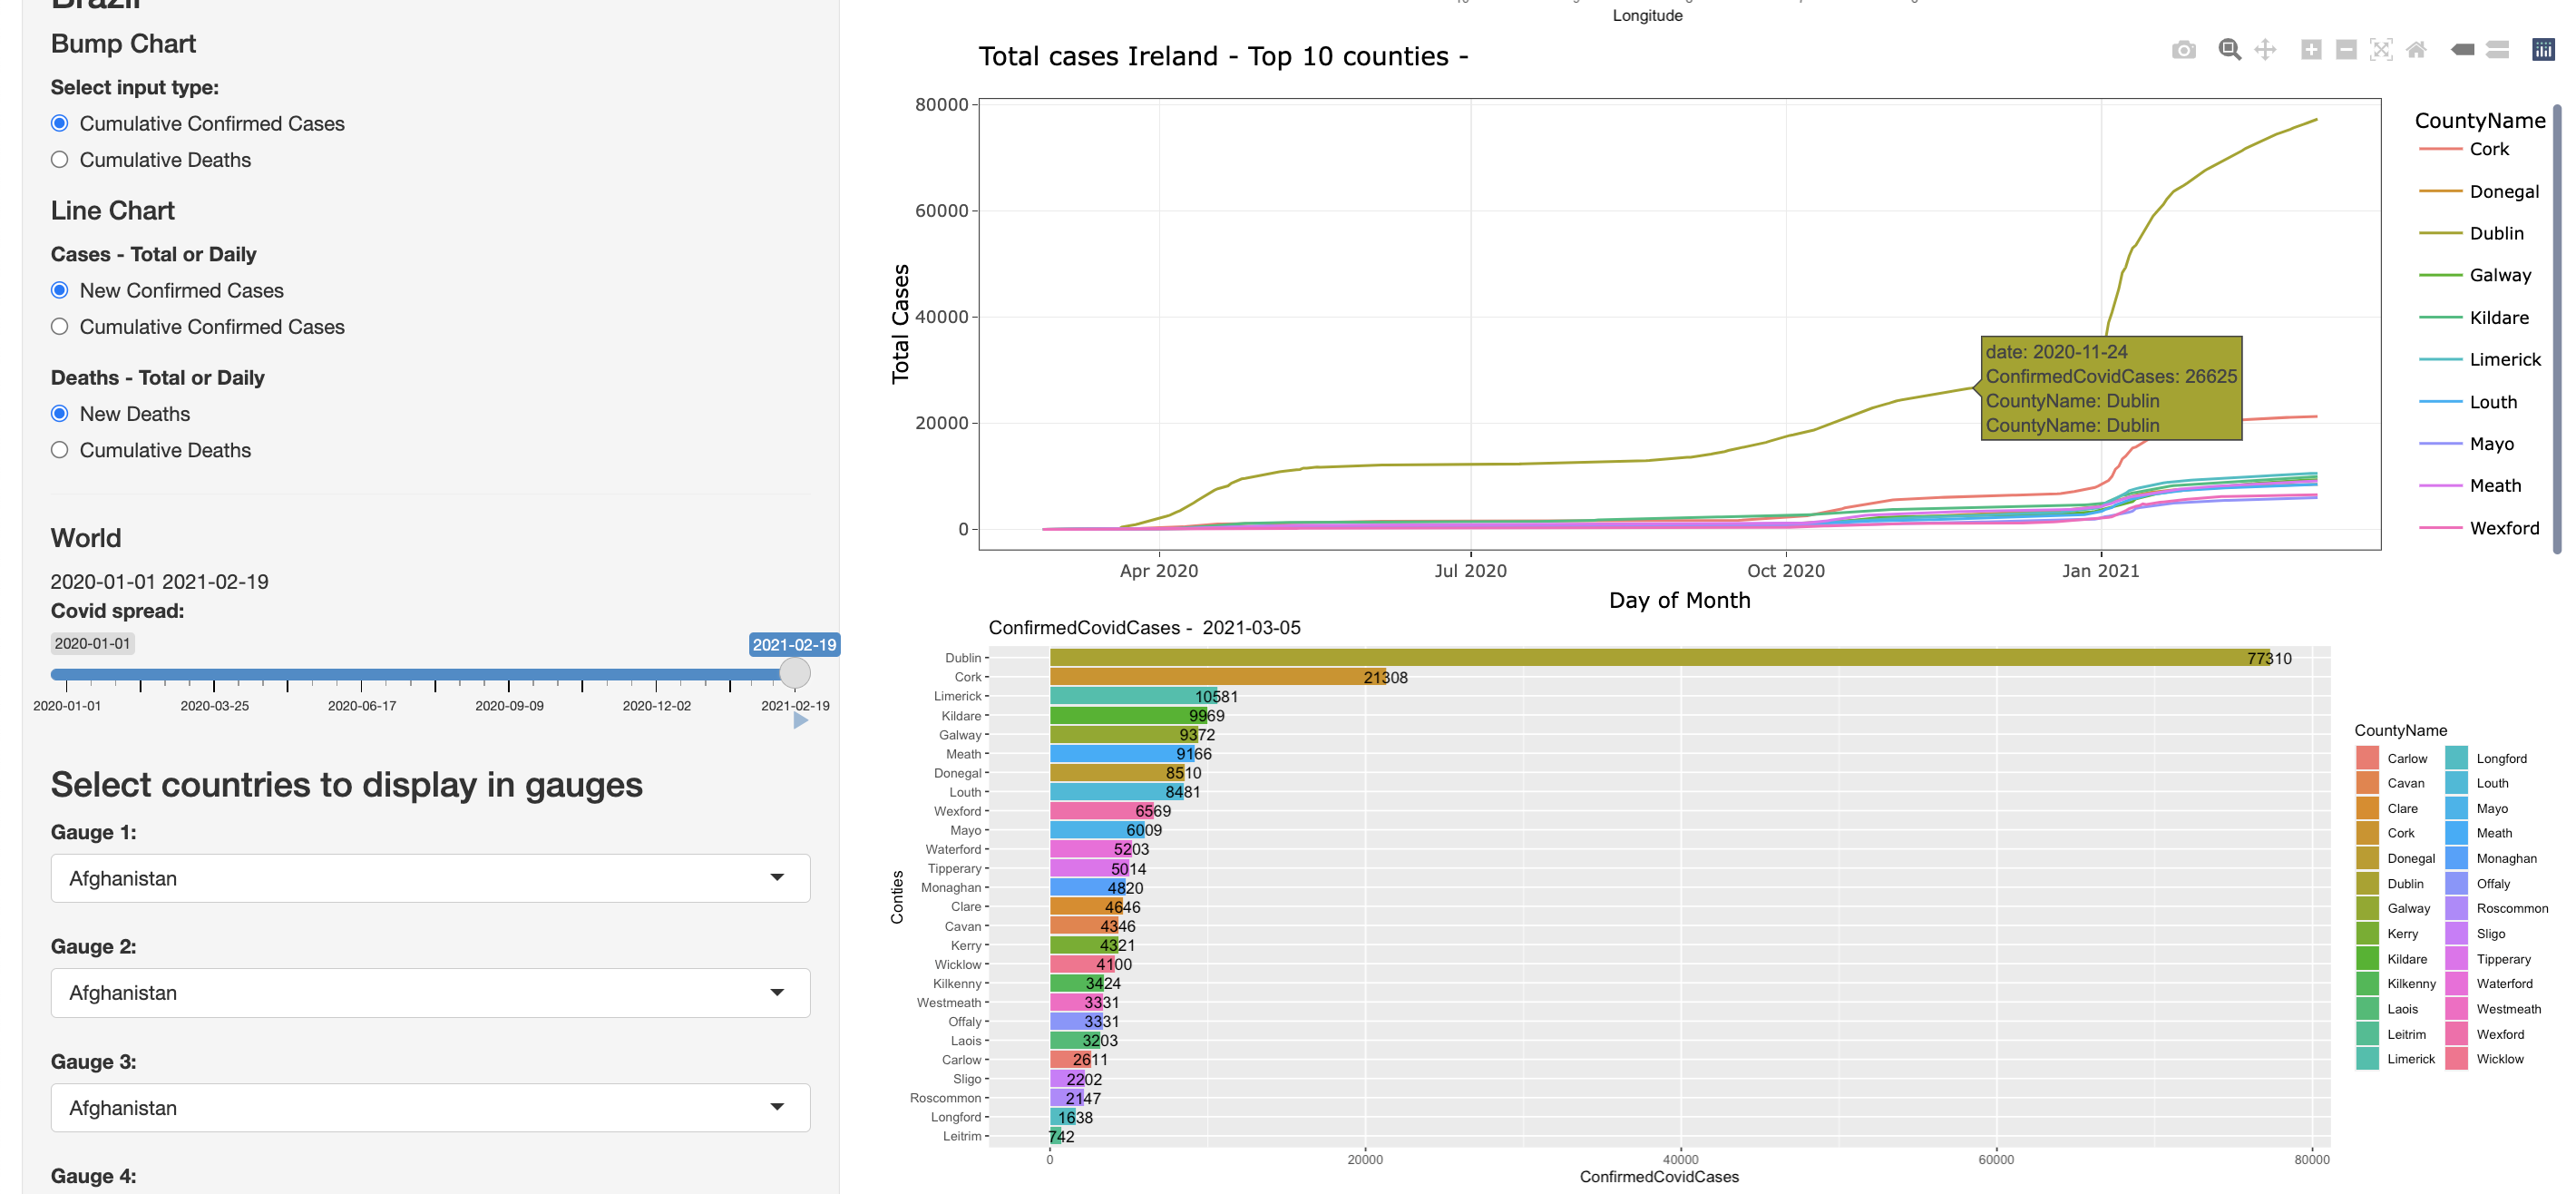 Ireland line and bar plot
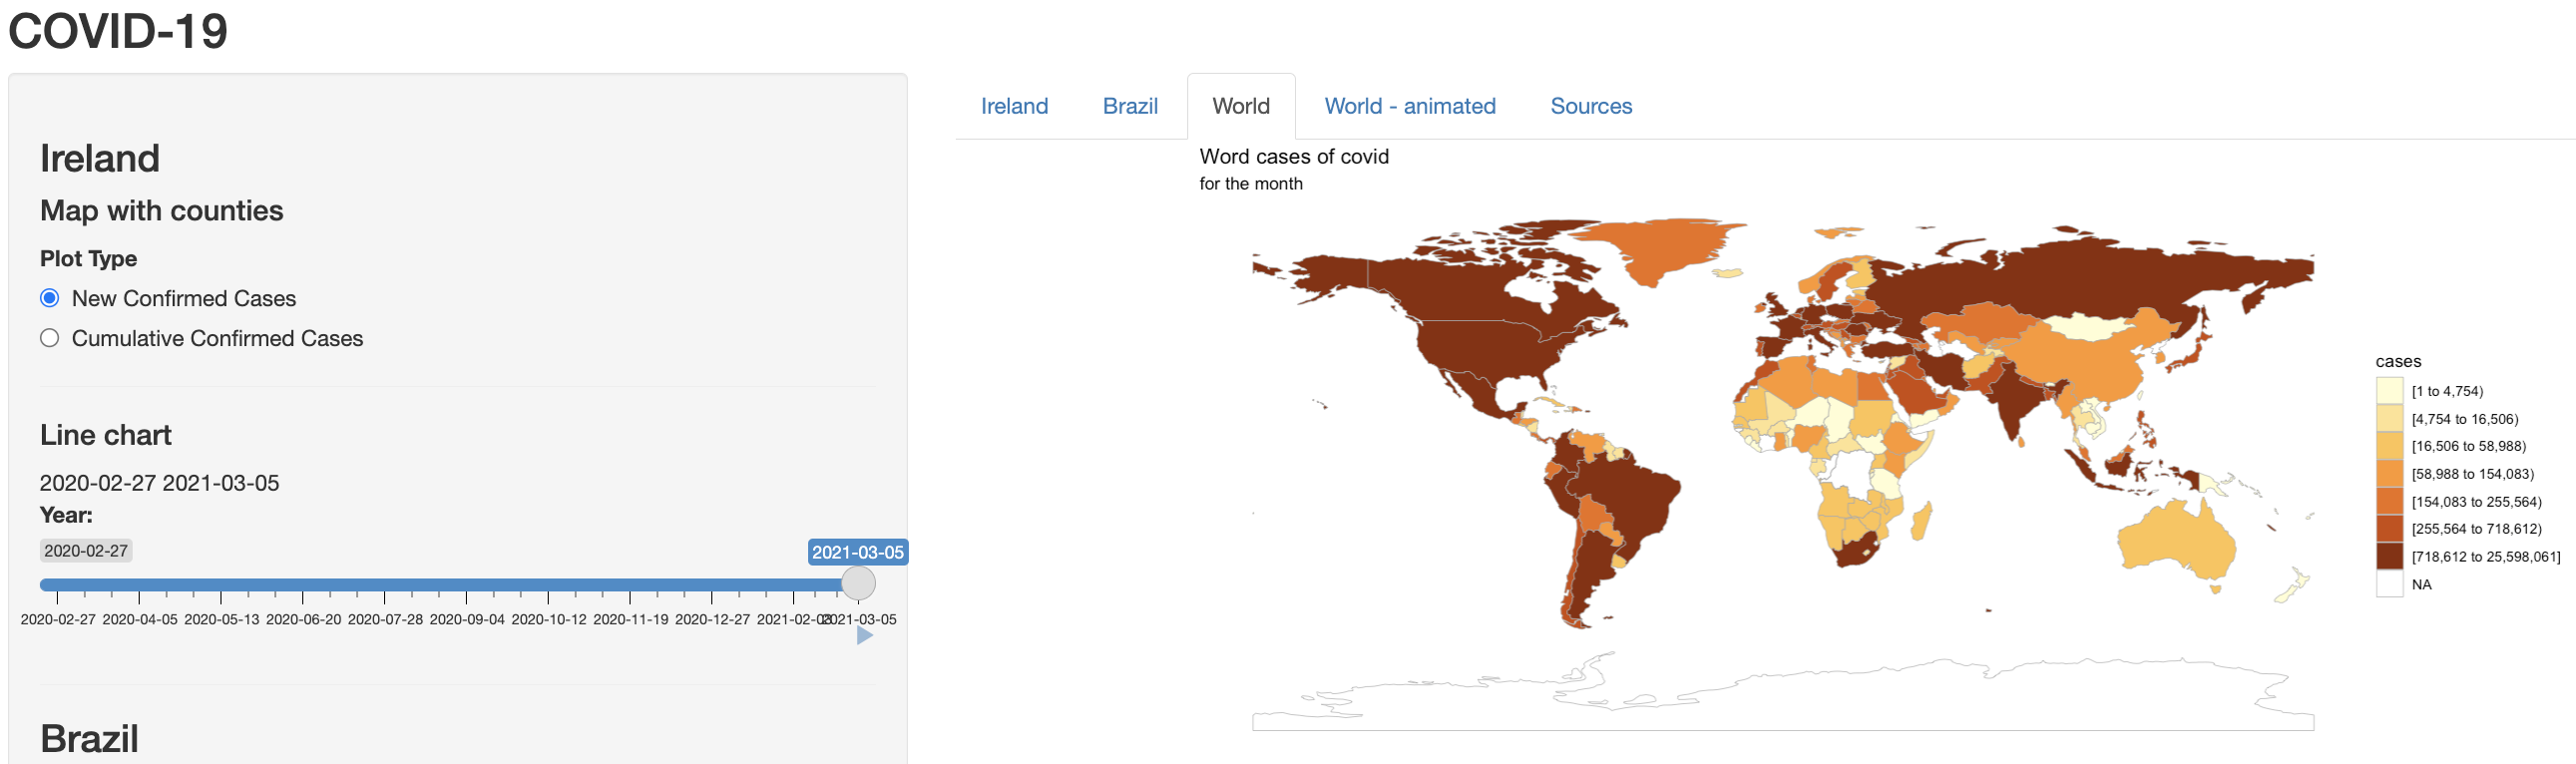 World Map
 Animated line plot
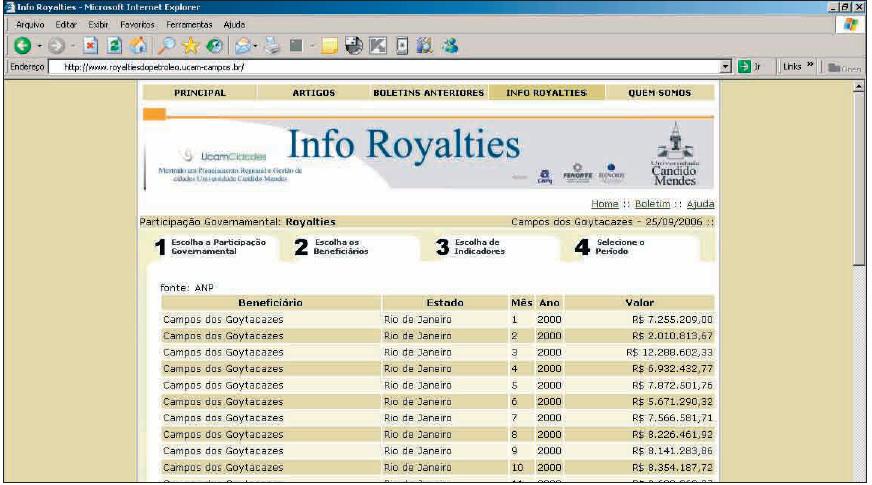
InfoRoyalties
The InfoRoyalties allows queries and cross-referencing data from royalties receivers in all Brazil. It was used as source of information in several research and newspaper about the distribution of income from oil royalties.
This project is still active and is maintained by the Candido Mendes University. https://inforoyalties.ucam-campos.br/
 InfoRoyalties
Technologies:
- PHP
- PostgreSQL
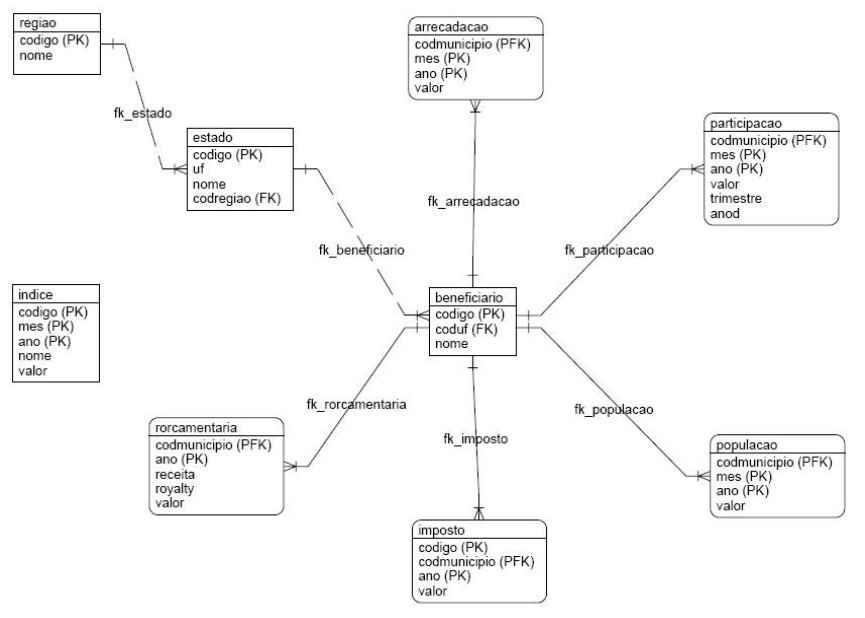 InfoRoyalties Database
All content related about InforRoyalties on internet
Article paper https://abepro.org.br/biblioteca/enegep2006_tr550371_7099.pdf
This is a blog post about InfoRoyalties: http://www.robertomoraes.com.br/2006/11/inforoyalties.html
https://www.upstreamonline.com/online/brazil-investigates-royalty-overpayment/1-1-1099959
GeoRoyalties
https://github.com/fellipepf/georoyalties